Blog 4
- jylai21
- Jan 19, 2023
- 4 min read
Updated: Jan 21, 2023
Hello Everyone! In this blog, I will be talking about Design Of Experiment (DOE). DOE is a extremely powerful tool that is used for discovering a set of factors which are important to the experimental process and then determine at which levels these factors must be kept to fully optimize the process performance. To demonstrate DOE, I will be sharing a case study here in this blog.
CASE STUDY
What could be simpler than making microwave popcorn? Unfortunately, as everyone who has ever made popcorn knows, it’s nearly impossible to get every kernel of corn to pop. Often a considerable number of inedible “bullets” (un-popped kernels) remain at the bottom of the bag. What causes this loss of popcorn yield? In this case study, three factors were identified:
1.Diameter of bowls to contain the corn, 10 cm and 15 cm
2.Microwaving time, 4 minutes and 6 minutes
3.Power setting of microwave, 75% and 100%
8 runs were performed with 100 grams of corn used in every experiments and the measured
variable is the amount of “bullets” formed in grams and data collected are shown below:
Factor A= diameter
Factor B= microwaving time
Factor C= power
Run Order | A | B | C | Bullets (grams) |
1 | + | - | - | 3.36 |
2 | - | + | - | 2.36 |
3 | - | - | + | 0.74 |
4 | + | + | - | 1.36 |
5 | + | - | + | 0.95 |
6 | + | + | + | 0.32 |
7 | - | + | + | 0.36 |
8 | - | - | - | 3.12 |
Which these values given, we can proceed to the Full Factorial and Fractional Factorial Methods
Full Factorial Method
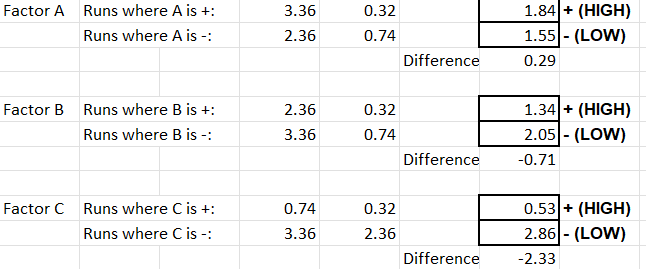
With the data given, we can get the HIGHS and LOWS of each factor and the average found is plotted on a graph

Using the average values found, a graph is plotted. The graph will show the gradient of each line, this will show how each factor affects the yield
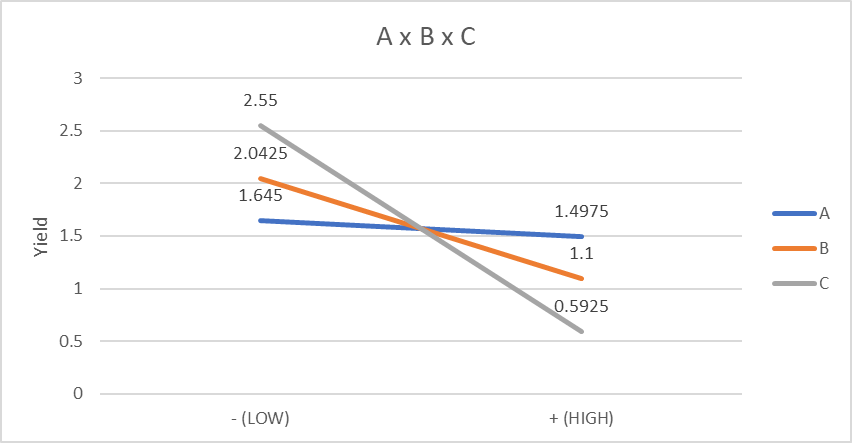
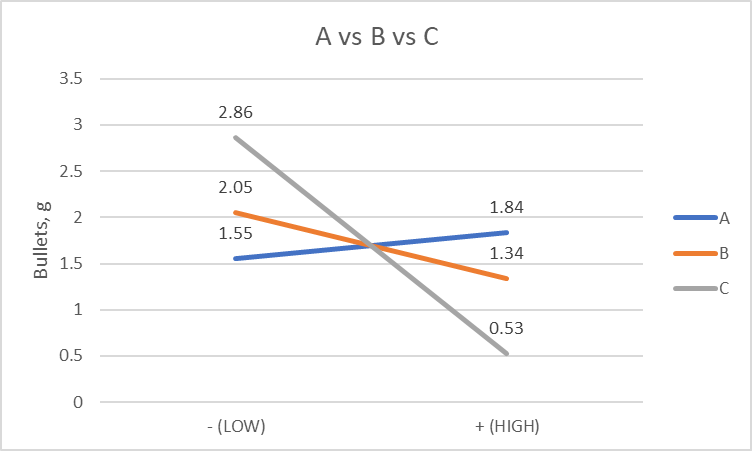
From this graph, we know that Factor C (Power Setting) is the most significant factor, followed by Factor B (Microwaving Time) then Factor A (Diameter) which is the least significant factor. This can be inferred through the gradient of the graph where Factor C (Power Setting) has the steepest gradient while Factor A (Diameter) has the gentlest graph.
Interaction Effects
Next, we will be studying the interaction effects among the 3 factor. This done to see how one factor will be affecting and causing a difference in the other factos separately.
A x B

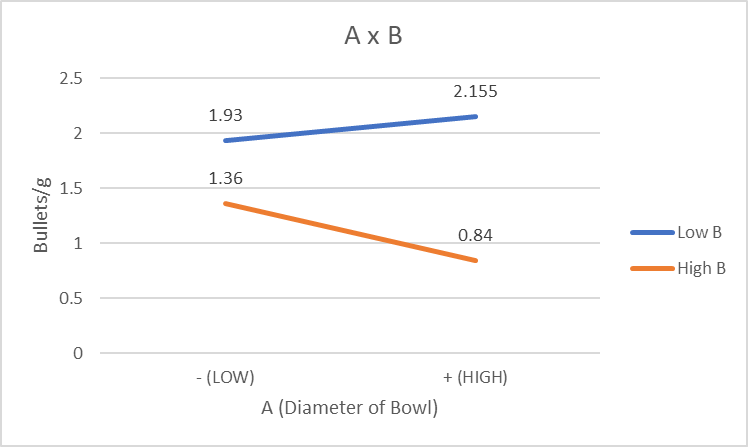
As the gradient of both lines are difference. (One is positive while the other one is negative). Therefore, there is a significant interaction between Factor A (Diameter) and Factor B (Microwaving Time).
A x C
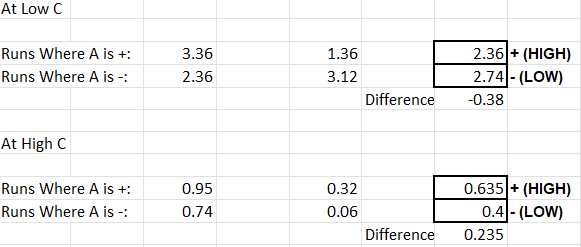
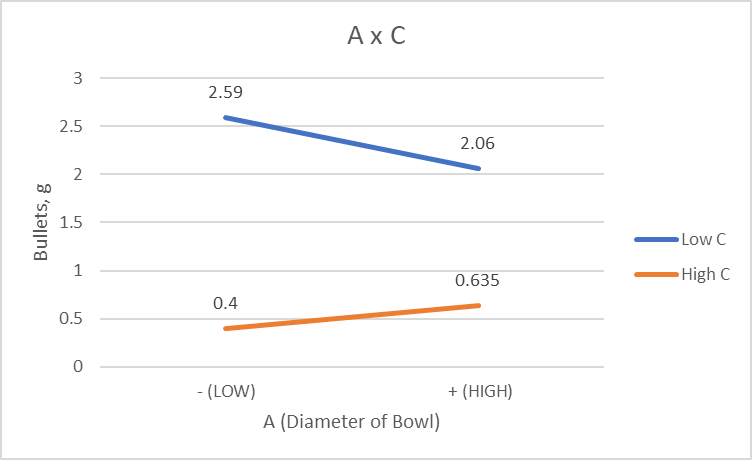
As the gradient of both lines are difference. (One is positive while the other one is negative). Therefore, there is a significant interaction between Factor A (Diameter) and Factor C (Power Setting).
B x C

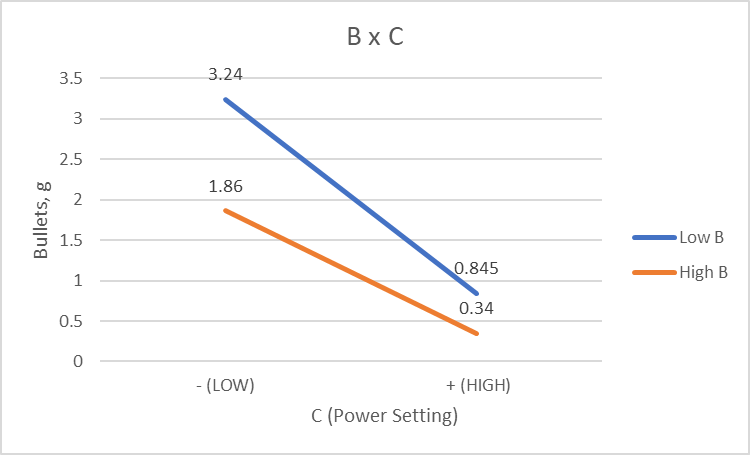
The gradient of both lines are different and their gradient is negative. The "Low B" is more steep than "High B". Hence, there is a significant interaction between Factor B (Microwaving Time) and Factor C (Power Setting).
Conclusion
From the A x B x C graph. Factor C (Power Setting) is the most significant factor, followed by Factor B (Microwaving time) and Factor A (Diameter of Bowl). Furthermore, the A x B graph's change in gradient is not as significant compared to the B x C graph, indicating that A is not a important factor compared to C. Overall, all of the factors affect each other, but B and C affects the amount of bullets being produced and affecting the final yield.
Fractional Factorial Method
For the Fractional Factorial Method, I use runs 1,2,3 and 6. The reason why I chose these 4 runs, they are balanced as they each have 2 high and low for each factor we have. This will allow for better comparison of the factors.
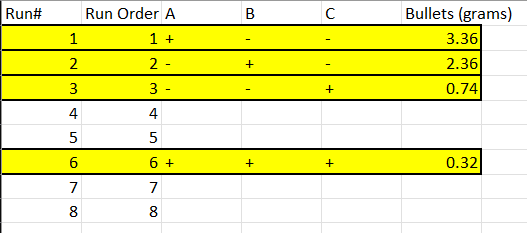
Based on the graph, we can see that Factor C (Power Setting) is the most significant factor as it has the steepest gradient while Factor A (Diameter of Bowl) is the least significant factor as it has the gentlest gradient.
Conclusion
From the data we gathered, we can conclude that Factor C (Power Setting) is the most significant factor. However, in Full factorial method, the gradient for Factor A (Diameter of Bowl) is negative while in Fractional Factorial Method, the gradient is positive. This could mean that there could be some missing data in Fractional Factorial graph. This is normal as we are only use 4 runs instead of the full 8 runs in Full Factorial Method. However, this mean that Factorial Factorial Method is not really reliable as there are discrepancies in the data.
Reflection
When Mr. Chua first introduced DOE to the class, I was very hesitant about learning more about DOE. As I was thinking to myself, "I am learning about Chemical Engineering. How does DOE able to help me in that" But as Mr. Chua continued on and allowed us to practice DOE, I realized that DOE is a powerful tool for us as a Chemical Engineer.
During the start of the practical, I did not really expect much from DOE as I thought that I already knew what how the factors will affect the data to what extent. In addition for the practical, we had to perform the Full Factorial Method, hence the total runs that we needed to do was 96. This was a huge amount of runs and it felt really boring and repetitive for the group.
When recording the data, I found out that how changing a single factor can drastically affect each run. This made me realize the importance of DOE as doing the experiment without a proper method, we will not find out how each factor can affect new data and this can cause a lot of confusion. In addition, the data is collected in a systematic manner, and it is important to ensure that the data is accurate and unbiased.
Hence, this made me change how I view DOE as it can be applied in Chemical Engineering. For example, like a chemical plant, it is important to know which process parameters affect the process. DOE can be applied to find the significant factors and least significant factors and changing these parameters can help optimise the chemical plants for optimal yield.
In conclusion, the Design of Experiment method is a potent tool for comprehending the connections between various variables and how they influence an experiment's outcome. It is a methodical and structured strategy that makes it possible to gather and analyze data that is accurate and objective. This approach is extensively employed in a variety of fields and is crucial for learning about and comprehending these topics. Overall, the DOE method is a crucial tool for experimentation and scientific study.


Comments